I'd like to talk a bit about a tool which I've used during past and present projects that employ Apache Kafka: KaDeck. KaDeck is developed by the Frankfurt/Germany-based software company Xeotek GmbH. Their website states that it is a holistic monitoring solution for Apache Kafka and Amazon Kinesis. I'm not going to recite the product brochure here, you can get the necessary details over at the folks of Xeotek. Instead I want to show you how you can use a tool like KaDeck to play around with the data you have, manipulate it and gain further insights from it. KaDeck comes in different shapes: You can use the desktop version which comes with basic functionality and only supports Apache Kafka, or you can use KaDeck as a web service and enjoy its full feature set including the integration of Amazon Kinesis. The single-user license for both versions is free of charge. Get it here. I'll be using the desktop version in the course of this article.
Showcase
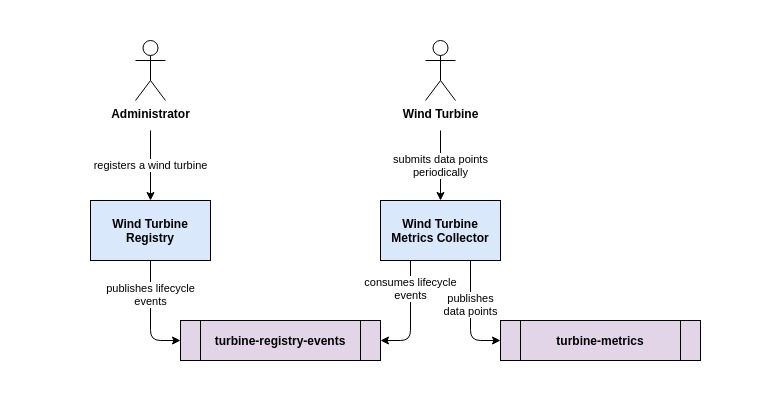
Our use case is to collect metrics from sensors that are attached to wind turbines. Be it revolution counters, vibration sensors, thermometers and the like: Many different sensors produce data non-stop that has to be processed in order to have an idea on the operational status of the turbine. For the sake of simplicity, the wind turbine periodically fetches the status from the attached sensors (we will restrict this to only a few) and submit a combined metrics data point in JSON representation to a downstream service.
Before this downstream service, call it Wind Turbine Metrics Collector, accepts those data points, the wind turbine must be registered at another service, call it Wind Turbine Registry. The Wind Turbine Registry handles the lifecycle of a turbine and publishes a registration event into a dedicated Kafka topic - call it turbine-registry-events (this works analoguously for the de-registration of a wind turbine).
The Wind Turbine Metrics Collector consumes these lifecycle events and thus knows, if an incoming data point is admissible given the registration state of the wind turbine from which it originated. The following diagram illustrates the basic idea.
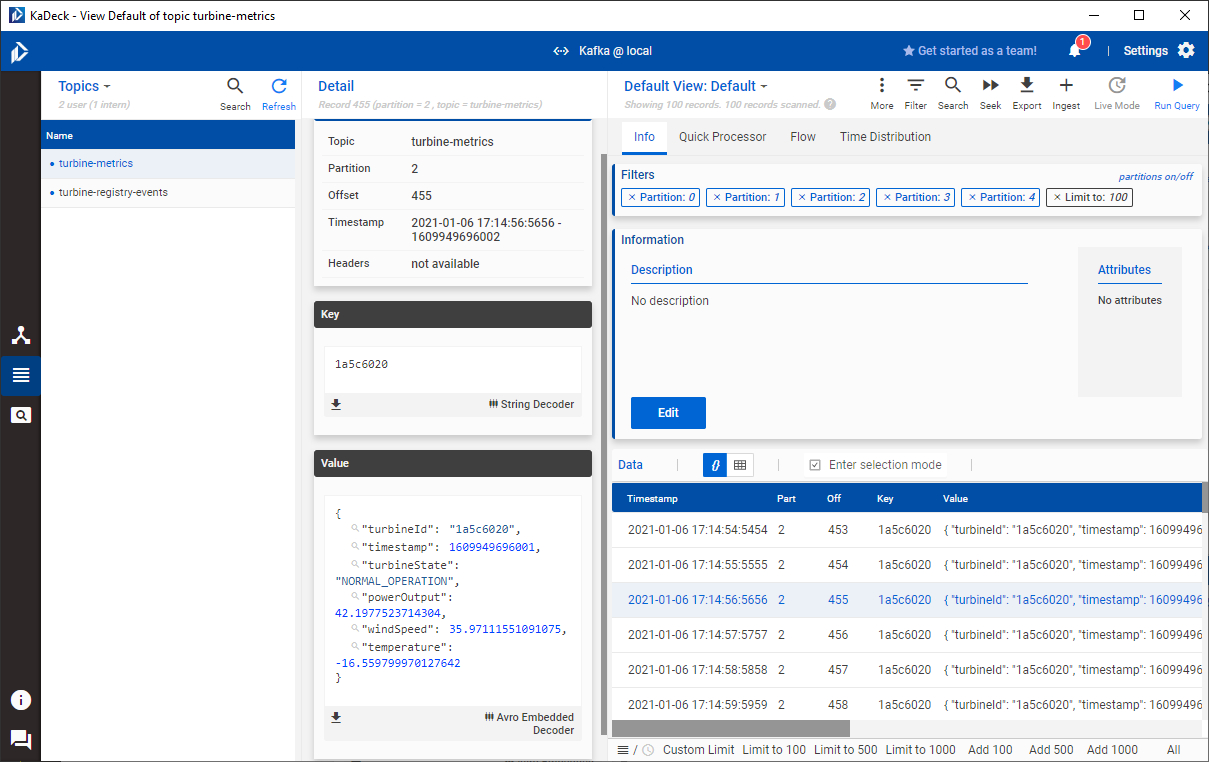
To keep things simple, we use a generator that produces these metrics once a wind turbine has been registered. A generated metrics data point looks like this:
{
  "turbineId": "1a5c6012",
  "timestamp": 1609944779000,
  "turbineState": "NORMAL_OPERATION",
  "powerOutput": 29.231588803231716,
  "windSpeed": 34.76472269743681,
  "temperature": -19.022032455541193
}
As you can see by looking at that data, the generator does not use realistic values. The values for the temperature metric for instance might increase or decrease significantly between two subsequent metrics data points. But the generator does implement a simple state transition model that takes the previous operational state of a wind turbine into account when it calculates the next state. Thus, we might observe that a wind turbine switches from NORMAL_OPERATION to an ERROR situation, goes back to CURTAILED_OPERATION if individual sub-systems still produce data of value and goes back to NORMAL_OPERATION after the error situation gets resolved. Of course, there is also the possibility that the state of the wind turbine is unknown, which could be the result of an erroneous metric collection unit at the turbine itself.
As you can already guess, we can derive a couple of monitoring situations from such a simple data set. But first things first: Let's fire up KaDeck and connect to a locally running Kafka cluster (by the way, KaDeck let's you spin up an embedded Kafka cluster as well if you're unfamiliar with deploying one yourself).
Getting started
After launching KaDeck, you are greeted with the connection overview. If you haven't done so before, you'll only see the embedded Kafka cluster as the screenshot below shows.
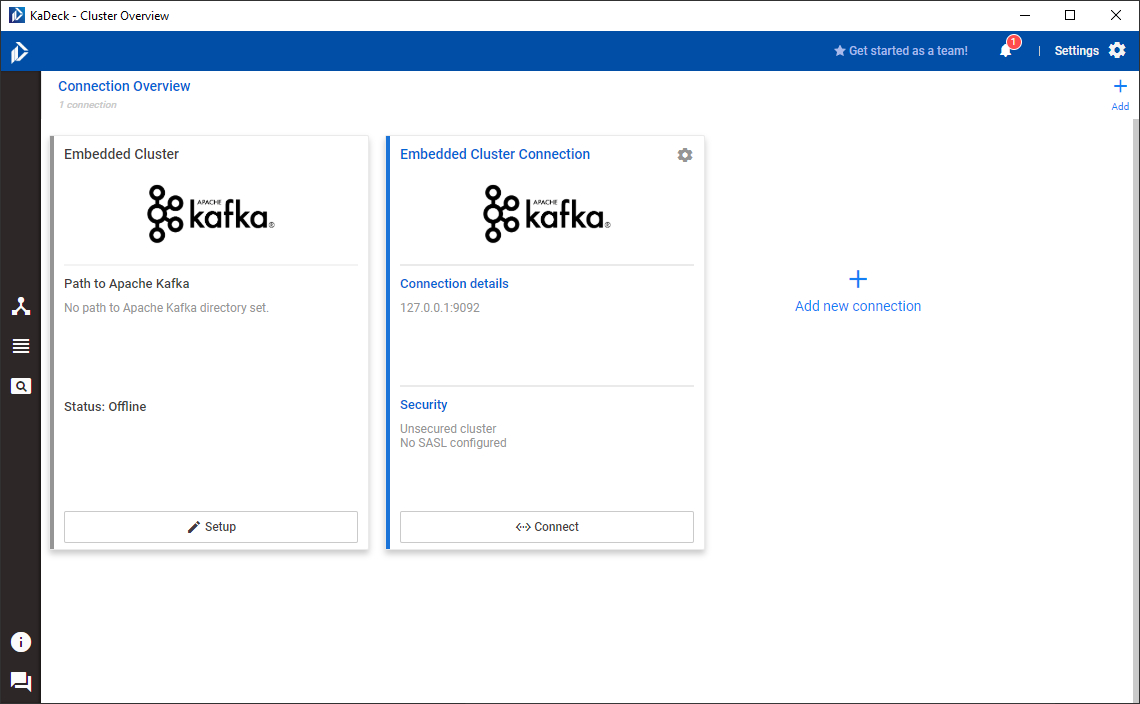
Let us add a connection to a locally running single broker Kafka deployment by clicking on Add new connection. The connection details for the local setup are shown in the screenshot below. Of course, the configuration for your setup will most likely vary, especially if you are using KaDeck in a production-grade setup where security mechanisms are in place.

After confirming and connecting to the local Kafka cluster, KaDeck shows you its confguration. We won't go into the details here, as we're ready now to use the Data Browser (see the icons in the menu to the left) to play around with our data. For that purpose, let us register a new wind turbine. The Wind Turbine Registry accepts a JSON payload that contains the ID of the wind turbine and additional information on its geographical location. The JSON payload looks like this:
{
    "turbineId": "1a5c6012",
    "longitude": 49.875114,
    "latitude": 8.978702
}
Exploring data
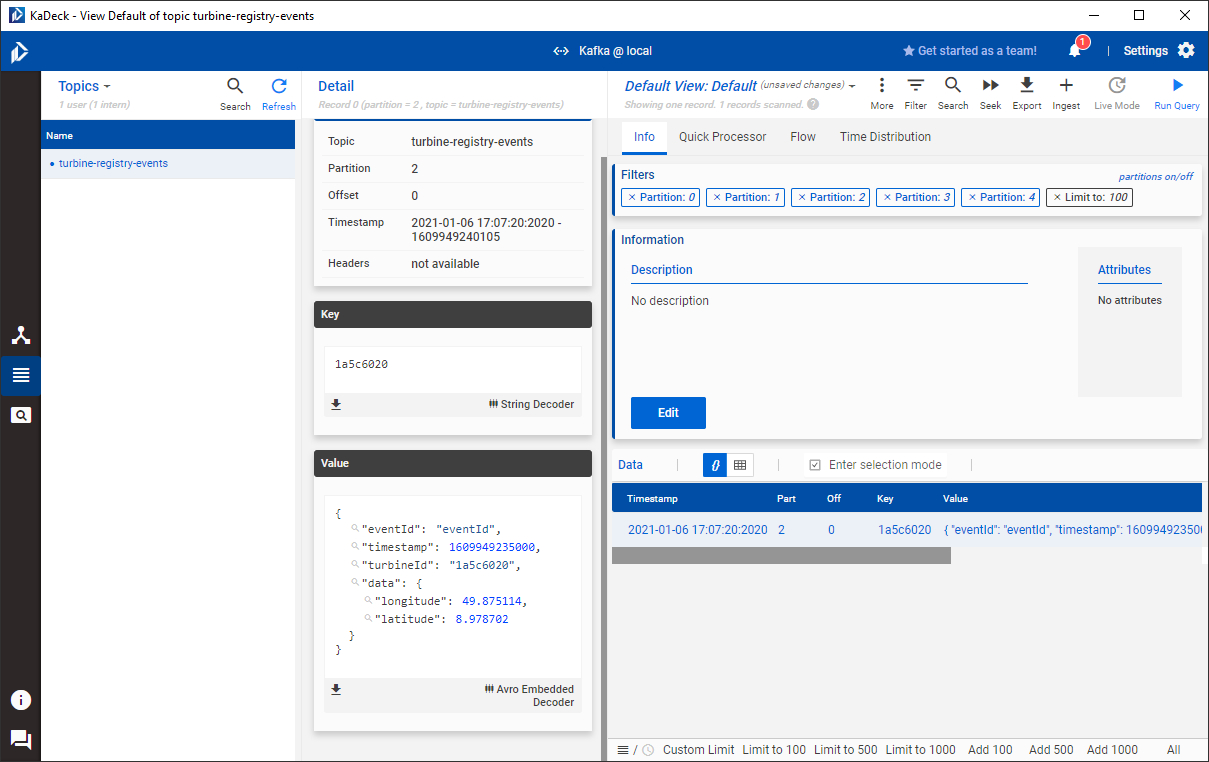
It takes a couple of seconds until the data is available. KaDeck now shows the newly created topic turbine-registry-events along with a single record in it. KaDeck is able to decode the schema of the Kafka record. In this case, I used Apache Avro to encode the binary representation of the record's payload. As you can see in the following screenshot, KaDeck decodes the payload correctly and provides a JSON-like representation of the data that is easy to read. Of course, this works with a JSON-based schema just as well. To keep things simple, the Avro schema is embedded within the individual records. You wouldn't do that in a production-grade setup, but employ a schema registry instead. KaDeck is able to work with the Confluent Schema Registry. The table shows the non-interpreted payload in column value. A nice feature of KaDeck is that it can figure out columnar data from the payload. If you click on the grid-like icon located above the record table, it switches to columnar mode and will infer the columns from the record data and present them as you would expect it.
In the meantime, our simulated wind turbine has generated a couple of data points that we can inspect.
Manipulating data
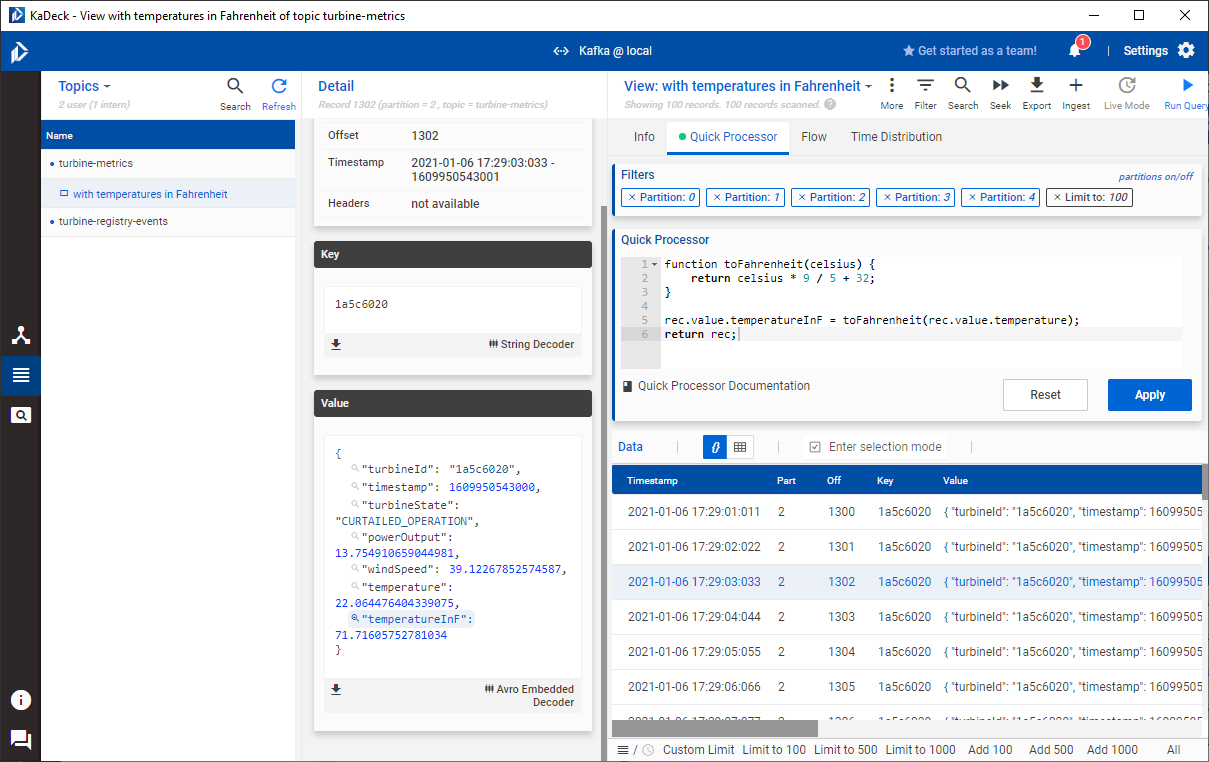
The temperature sensor of the wind turbine submits its data in Celsius. Suppose we work with an international team and some members of that team are more familiar with interpreting temperatures in Fahrenheit. Using a Quick Processor we can augment each and every record with derived data. For this, we'll switch from the default view of the topic to a new dedicated view. We can create a new view by clicking on the Default View: Default link at the top of the screen, select New view from current and call it with temperatures in Fahrenheit. KaDeck shows all individual topic views grouped together with the topic in the browser on the left. Now, we'll switch to the Quick Processor tab and are presented with a small code editor. The processing logic has to be written in JavaScript. We'll use the following code to add a function that is able to convert from Celsius to Fahrenheit.
function toFahrenheit(celsius) {
    return celsius * 9 / 5 + 32;
}
The Quick Processor works in the context of a single record. The record is bound to the variable rec, and by accessing its value, we can manipulate existing attributes or add new ones to it. In our case, we'll simply add another attribute like so:
rec.value.temperatureInF = toFahrenheit(rec.value.temperature);
return rec;
Instead of returning true, it is important to return the altered rec instead. After hitting apply, we'll notice that the table as well as the record details have been updated and include an attribute called temperatureInF.
Don't forget to save the state of the view!
Filtering data
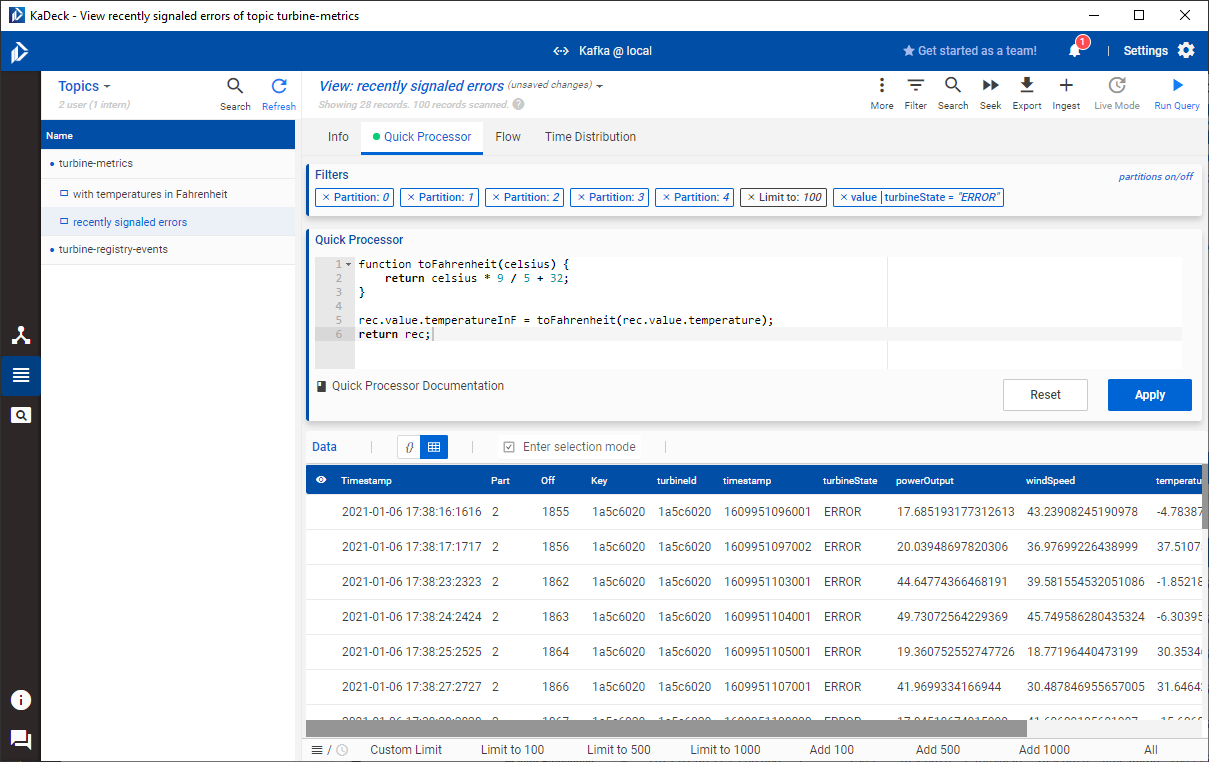
Let's create another view derived from the one we just created - call it recently signaled errors. We'll add a filter to it that only shows us those metrics that reported an error. There are two ways to create filters:
- Select a record from the table to bring up its details. Then hover over the attribute you'd like to filter on, click it and supply the parameters of the filter. Applying the filter will trigger KaDeck to update the view.
- Click on the Filter option in the view's menu. This brings up the Attribute Filter Dialog.
Both ways apply the same semantics and thus yield the same results. Let's also switch to columnar mode. The screenshot below shows the result of the filter.
Of course, you can apply more filters to reduce the size of the resulting view. For instance, by clicking on the clock icon below the record table, we get a variety of pre-configured time-based filters that operate relative to the current time. Selecting the 30s option shows us only those records, whose timestamps are not older than 30 seconds. This already gives us a good idea on all recent wind turbines that are malfunctioning and probably require maintenance. What is missing though is a filter that restricts the view to the newest record of all records that share the same record key. KaDeck is in constant development and the developers are eager to improve the data processing capabilities of KaDeck, so I'm sure that we'll see new additions in that regard in future versions of KaDeck.
Exporting derived data
Another cool feature of KaDeck is that it can export views to CSV or JSON. This comes in handy when we have to generate reports from the insights we gathered. Let's create another view derived from the recently signaled errors view and switch the record table into columnar mode. Now, by right-clicking on a column, we can simply remove it from the table, thereby altering the width of our data points to just the subset that we need for our data export. For the sake of this example, I'll remove everything but the timestamp, the ID of the turbine in question and its turbine state. The following screenshot shows the resulting view.
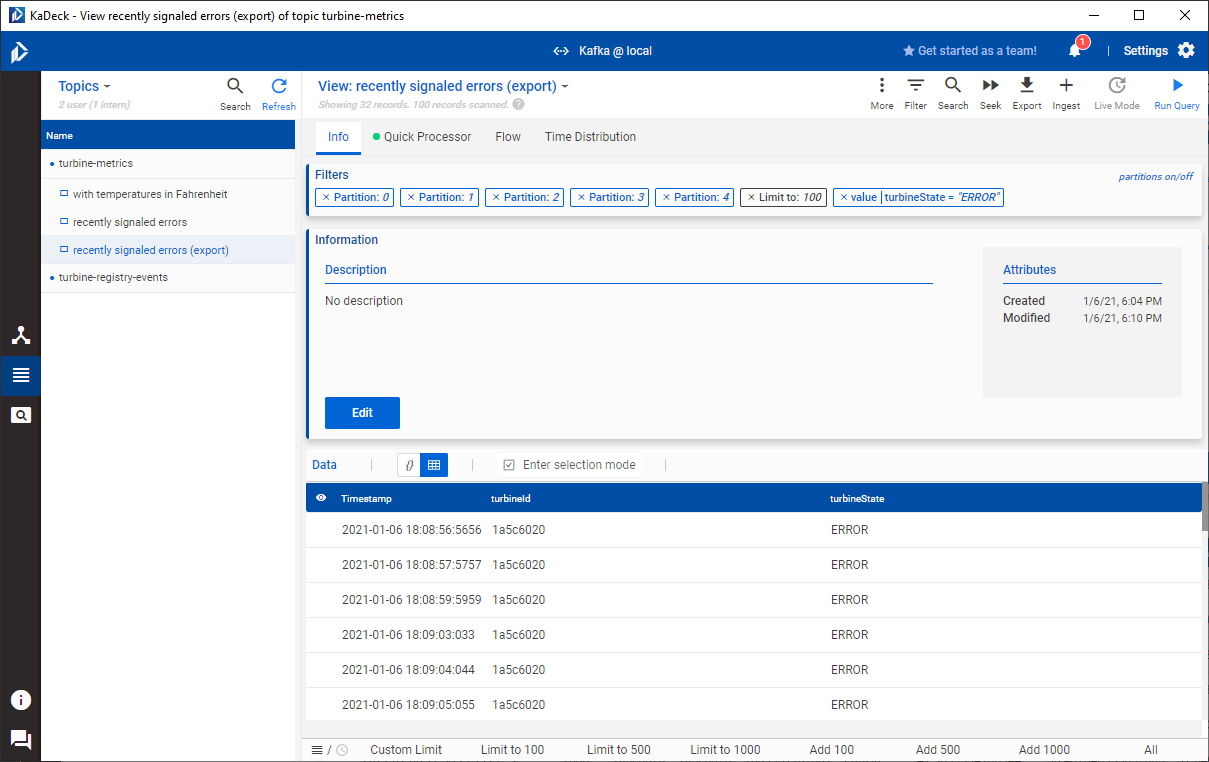
Clicking on Export in the view's menu brings up the Export records dialog. Choosing CSV as the target format will restrict the width of the data to the columns currently shown in the table. However, this only seems to work if you have saved your view beforehand. Uncommitted changes are not reflected in the export. This might seem a bit counterintuitive, but as the issue is easily mitigated, it's okay I guess. Anyhow, here's the CSV export for the selection I've made.
timestamp,turbineId,turbineState
1609953581000,"1a5c6020","ERROR"
1609953582000,"1a5c6020","ERROR"
1609953592000,"1a5c6020","ERROR"
[...]
Unfortunately, if you choose JSON as the target format, the export function won't respect the modified representation of the record table, but will export the full width of data instead. This is also a bit counterintuitive, since the result of the Quick Processor seems to be unaffected by this. Hence, if you added attributes using a Quick Processor, the export into JSON will also include these values. This suggests that the semantics of the export function are incoherent with KaDeck's data filtering and data manipulation capabilities. This is definitely something that should be addressed in a future release. Knowing these caveats, we can work around them, although this can be a bit cumbersome.
Conclusion
I was looking for a mere topic browser that supports Apache Kafka for quite some time now. I've worked with Kafka Tool in the past and it did satisfy that basic need. But it doesn't seem to evolve past that point. About a year ago I turned to KaDeck instead and have been using it ever since. It is not just a simple topic browser, but comes also with a rich set of data filtering and data manipulation capabilities that let you quickly generate reports from derived data. We've only discussed a part of the features that KaDeck comes with. Check out the website to learn more.
My latest use case is probably a bit different from what you'd expect. I'm experimenting with word embedding models that are derived from domain-specific (and thus contextual) data. I do stream the original data into a Kafka topic, explore it and transform it on-the-fly to generate exports that I can feed into a Python script that trains the model. KaDeck makes this kind of work easy.
KaDeck comes in handy during the development of applications that integrate with Apache Kafka as well. I'm able to quickly observe the contents of a topic or produce a data record to trigger an ingress interface of a Kafka-based application.
Of course, like with any tool, it has its caveats and limitations. It is unfortunate that you cannot stream derived data into a dedicated topic. You cannot combine multiple streams to produce new data that is then streamed into another topic. But you'd probably use KSQL for this kind of work anyway. Still, a tighter integration with Kafka Streams or KSQL for that matter would be beneficial.
But nonetheless, KaDeck has the potential to ease your workflow when it comes to monitoring or developing applications that integrate with Apache Kafka. Be sure to give it a try!